Professional Market Analysis: The Top-Down Approach
How to analyze any chart from scratch. Learn the institutional 'Top-Down' method to identify high-probability setups.
Stop Trading the 5-Minute Chart Blindly
One of the biggest reasons traders fail is Timeframe Myopia. They stare at the 1-minute or 5-minute chart, trying to catch every small movement, completely unaware that the Weekly trend is barrelling against them like a freight train.
Top-Down Analysis is the antidote. It is the process of analyzing the market from the highest timeframe (HTF) down to the lowest timeframe (LTF) to find entries that align with the "Big Money" flow.
The Core Concept: Fractal Nature
The market is fractal. A trend on the 1-hour chart might just be a small retracement on the Daily chart.
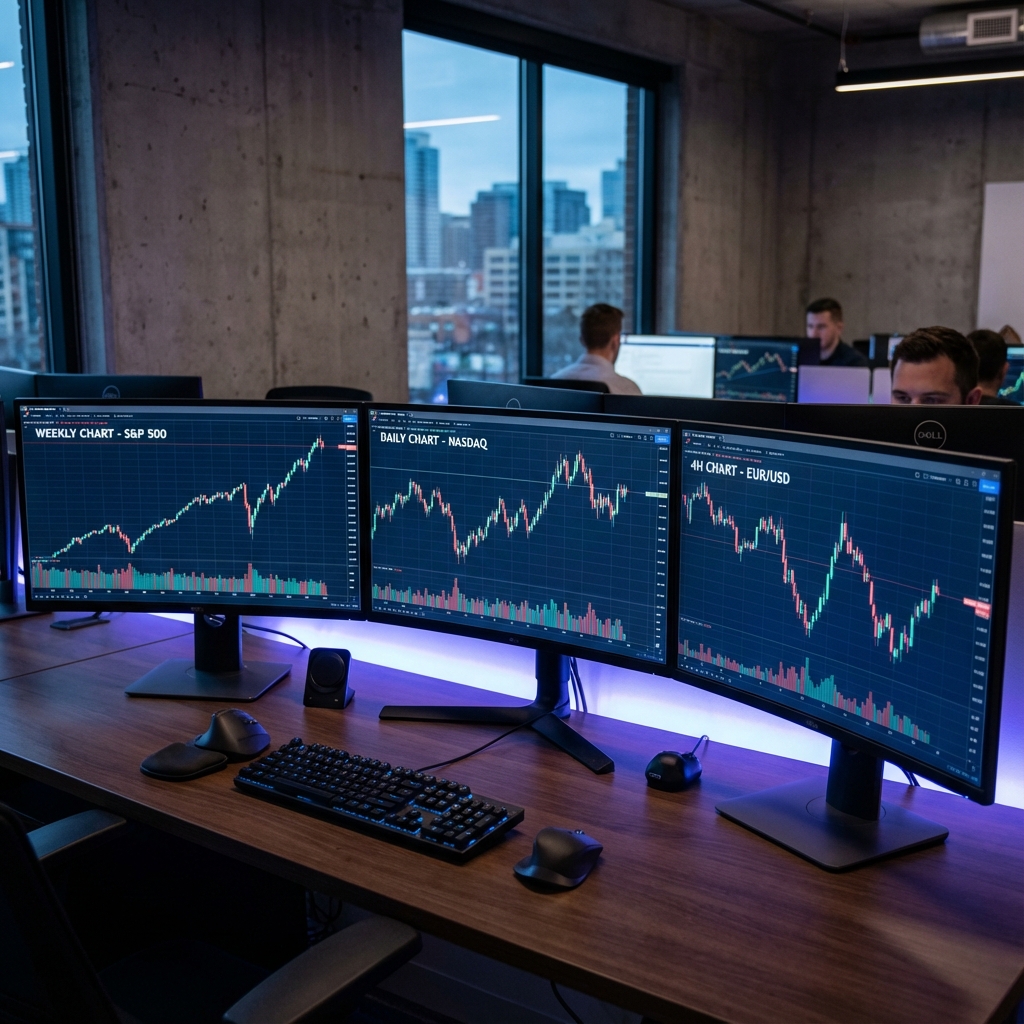
- Monthly/Weekly: The Roadmap (Direction)
- Daily/4H: The Structure (Key Levels)
- 15m/5m: The Entry (Trigger)
If you buy on the 5m chart because "it looks bullish," but the Daily chart is hitting a massive resistance supply zone, you are essentially gambling against the tide.
Step 1: The Macro View (Weekly/Daily)
Start every week by zooming out. Way out.
What to look for:
- Trend Direction: Are we making Higher Highs (Bullish) or Lower Lows (Bearish)?
- Key Levels: Where are the major Support & Resistance zones that haven't been tested yet?
- Psychological Levels: Big round numbers (e.g., Bitcoin $100k, EURUSD 1.1000).
Action: Mark your Weekly Highs/Lows and major Supply/Demand zones. These are your "Do Not Trade Against" walls.
Step 2: The Structural View (4-Hour/1-Hour)
Now that you know the big picture direction (e.g., Weekly is Bullish), drop down to the 4H or 1H.
What to look for:
- Market Structure Shift (MSS): Has the 4H aligned with the Weekly trend?
- Order Blocks: Find the institutional footprint—the last down-candle before the explosive move up (in a bull trend).
- Inducement: Look for "fake" support levels that retail traders are using as stop losses. Institutions love to sweep these liquidity pools before the real move.
The Golden Rule: We only want to trade when the 4H structure agrees with the Weekly bias.
Step 3: The Entry Trigger (15m/5m)
This is the sniper scope. You have your zone (from the 4H). You have your bias (from the Weekly). Now you wait for price to enter your zone.
Do NOT place limit orders blindly.
Wait for confirmation.
- Price hits 4H Demand Zone.
- Wait for a Change of Character (CHoCH) on the 5m or 15m chart. (Price breaks the minor lower high).
- Enter on the re-test of that breakout.
- Stop Loss: Below the swing low.
- Target: The next major liquidity pool (High/Low).
Fundamental Analysis: The Catalyst
Technical Analysis tells you where to enter. Fundamental Analysis tells you when to move.
Always check the Economic Calendar (Forex Factory, Investing.com) before the week starts.
- Red Folder Events (NFP, CPI, FOMC): These inject massive volatility.
- Rule: Do not initiate new scalps 15 minutes before or after a Red Folder event. Let the dust settle.
Putting It All Together: A Routine
The best analysis is a consistent one. Build this habit:
Sunday Night:
- Open specific charts (e.g., GBPUSD, BTCUSD, XAUUSD).
- Mark Weekly/Daily levels.
- Set alerts at key zones.
Daily Morning:
- Check 4H structure.
- Adjust alerts.
- Check Economic Calendar.
Session Start:
- Look for 15m/5m confirmations at your alerted zones.
- Execute with 1% risk.
Learn to See the Matrix
Top-Down Analysis allows you to stop reacting to every green or red candle and start anticipating moves before they happen.
It takes practice to align three different timeframes in your head. But once you "see" it, you can't unsee it.
Want our full weekly analysis PDF? We post detailed Top-Down markups for 10+ pairs every Sunday in the DAQ Capital Premium area. Stop guessing and start following a professional roadmap.