2026-01-05•Andreas
Why Indicators Lag (and Why We Use Price Action)
RSI says 'Oversold' but price keeps dropping? Learn why indicators fail and why reading the candles is the only truth.
The Lagging Indicator Trap
Beginners fill their charts with RSI, MACD, Bollinger Bands, and Moving Averages until they can't see the price. Here is the secret: All these indicators are calculated using PAST price data. They tell you what happened, not what is happening.
The "Oversold" Myth
RSI goes below 30. You buy. Price drops more. RSI stays at 20. You blow your account. In a strong trend, indicators can stay "oversold" or "overbought" for weeks.
Price Action: The Source Code
Price Action allows you to see institutional intent in real-time.
- Wicks: Show rejection and order absorption.
- Body Size: Shows momentum strength.
- Structure: Higher highs/lows show trend direction clearer than any moving average.
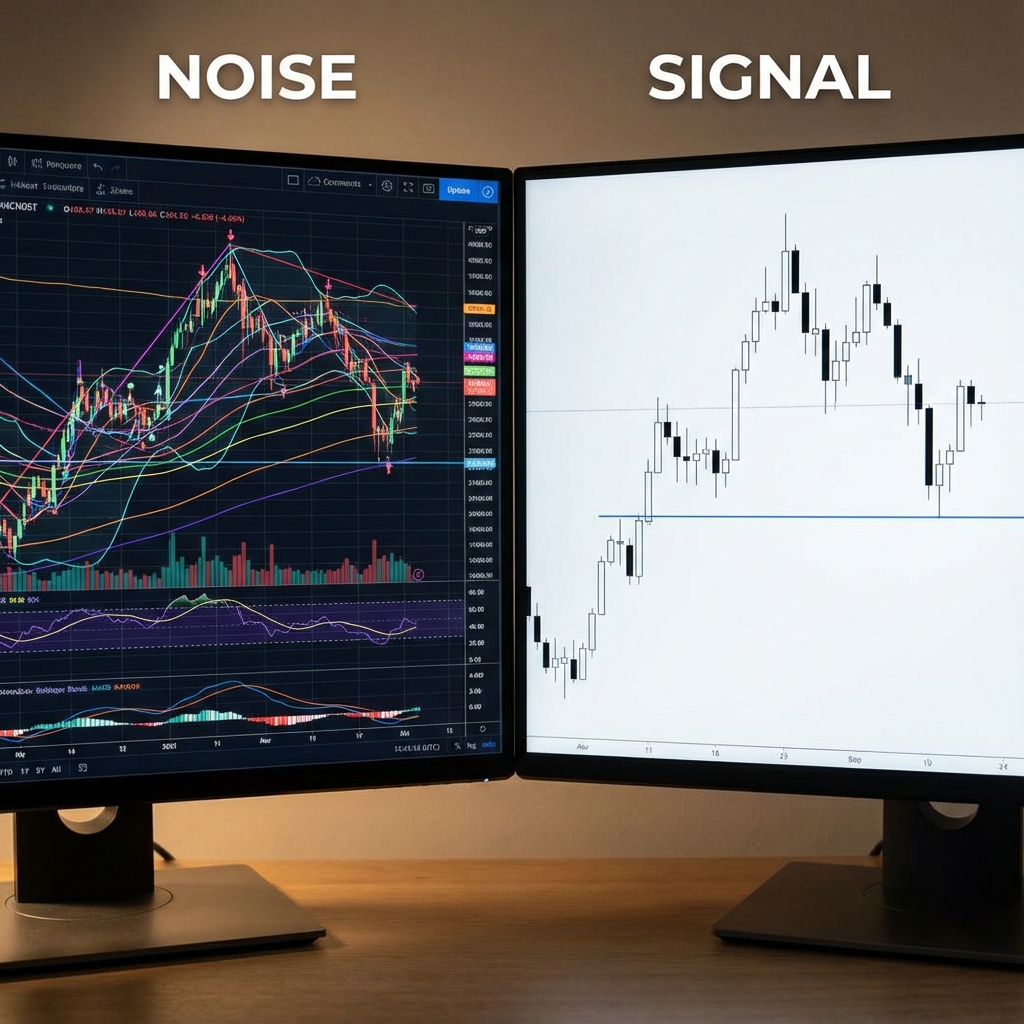
Clean Your Charts
Remove the noise. Focus on:
- Market Structure (Trend).
- Support & Resistance (Supply/Demand).
- Candlestick Reactions.
Trading is hard enough. Don't make it harder with conflicting signals.